CCO Humber Bank
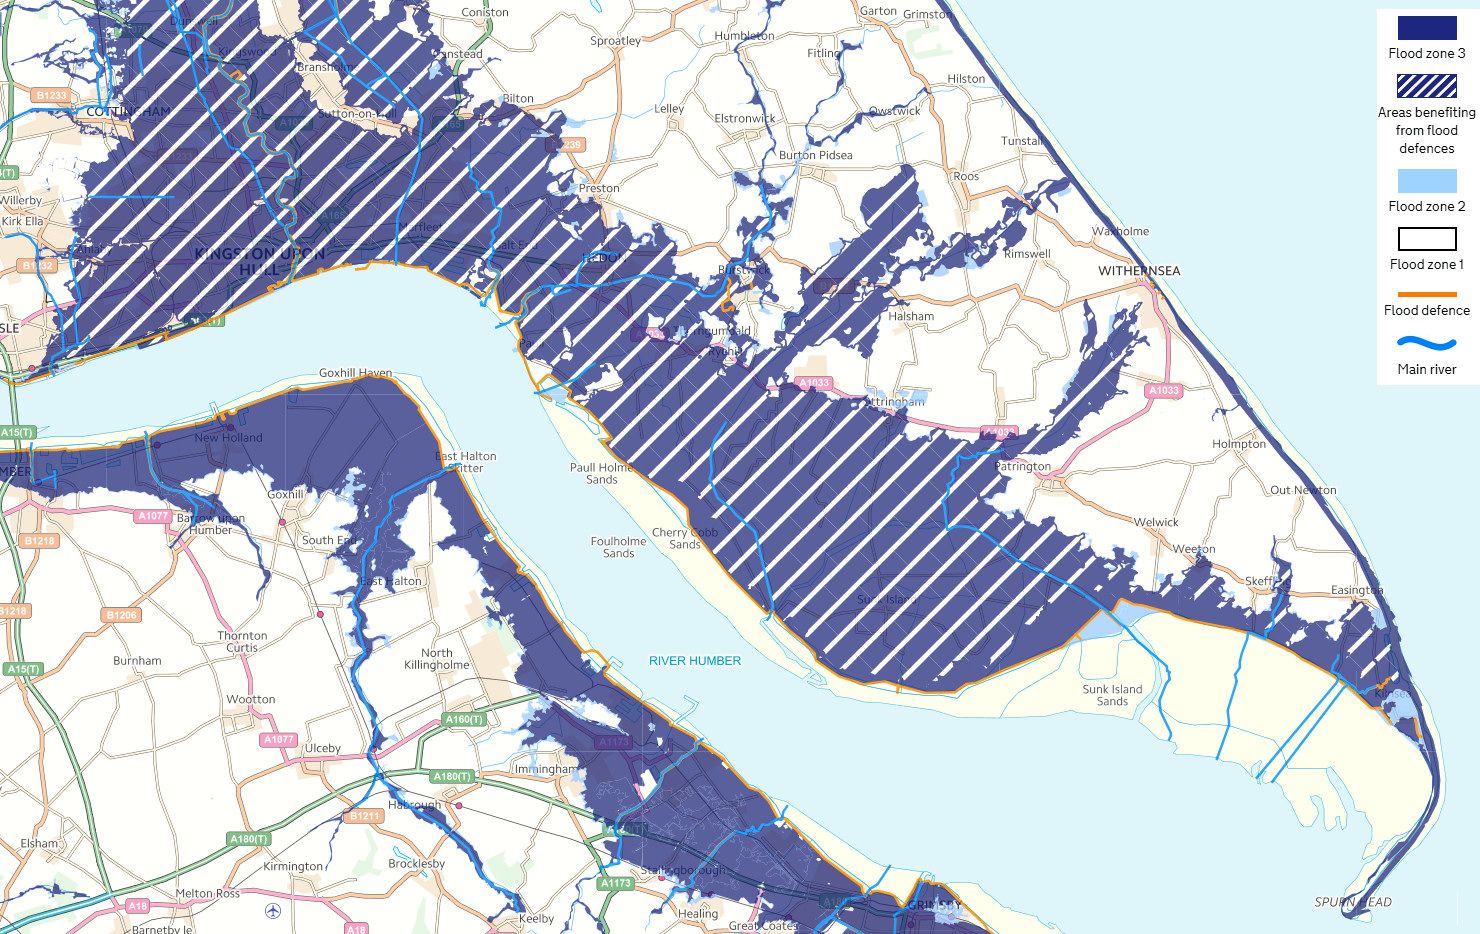
The above map from flood-map-for-planning.service.gov.uk shows the likelyhood of flooding in this area.
As you can see from the above map, the whole north bank, and most of the south bank is protected by flood defences. This is made up largely by creating a dike which is a long wall or embankment built to prevent flooding from the sea.
Flood zones have been created by the Environment Agency to be used within the planning process as a starting point in determining how likely somewhere is to flood. However, they only refer to flood risk from rivers or the sea, and not all rivers are included. The most important thing to remember is a flood zone is predominantly a planning tool and doesn’t necessarily mean somewhere will or won’t flood.
Areas deemed to be in flood zone 1 have been shown to be at less than 0.1% chance of flooding in any year, this is sometimes known as having a 1:1000 year chance.
Areas deemed to be in flood zone 2 have been shown to have between 0.1% – 1% chance of flooding from rivers in any year (between 1:1000 and 1:100 chance) or between 0.1% – 0.5% chance of flooding from the sea in any year (between 1:1000 and 1:200 chance).
Flood zone 3 is actually split into 2 separate zones; 3a and 3b by the local planning authorities however the EA do not split the zone and as such their maps only identify a general flood zone 3. Areas within flood zone 3 have been shown to be at a 1% or greater probability of flooding from rivers or 0.5% or greater probability of flooding from the sea.