CCO Sunk Island
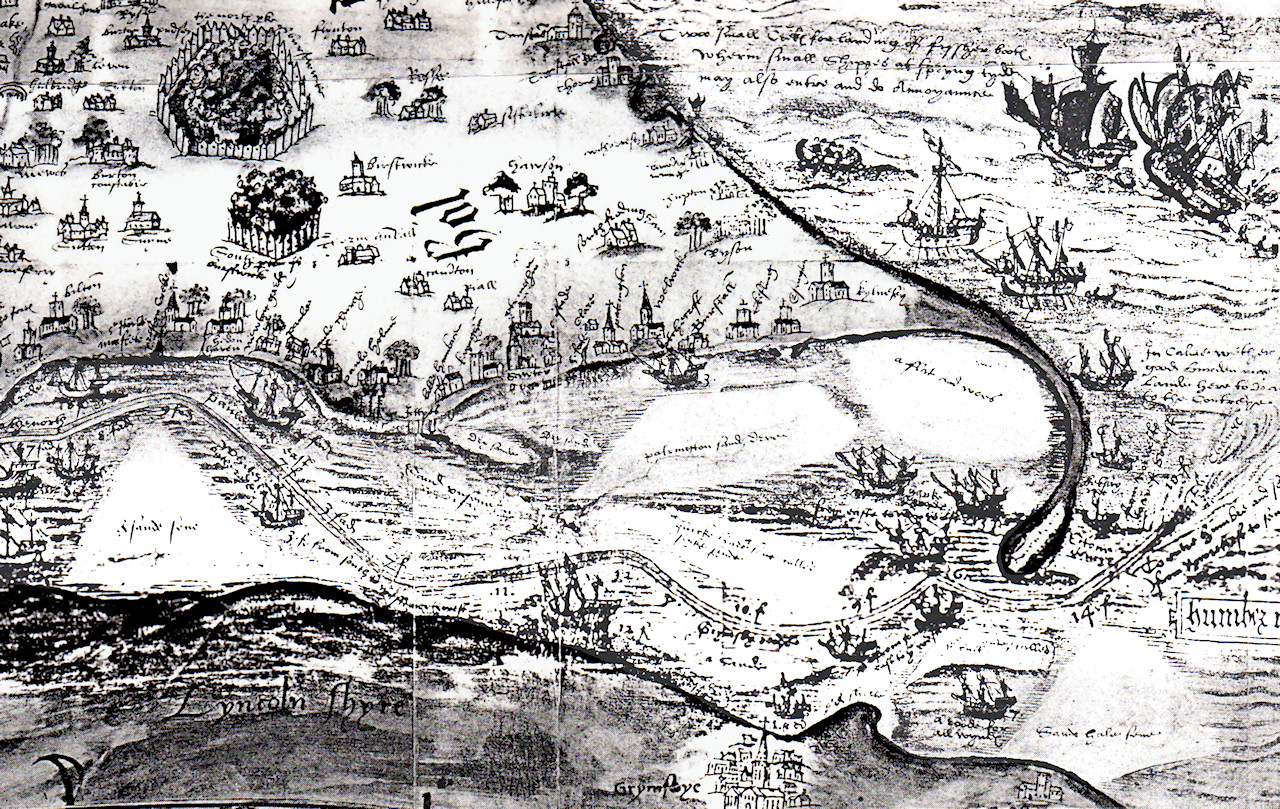
This charming map from 1580 shows the many sand banks in the Humber. There was a navigable channel allowing ships to reach Easington, Skeffling and even Patrington. A sand bank called ‘Sonke Sands’ first appeared two miles south of the Humber bank at Ottringham early in the 17th century.
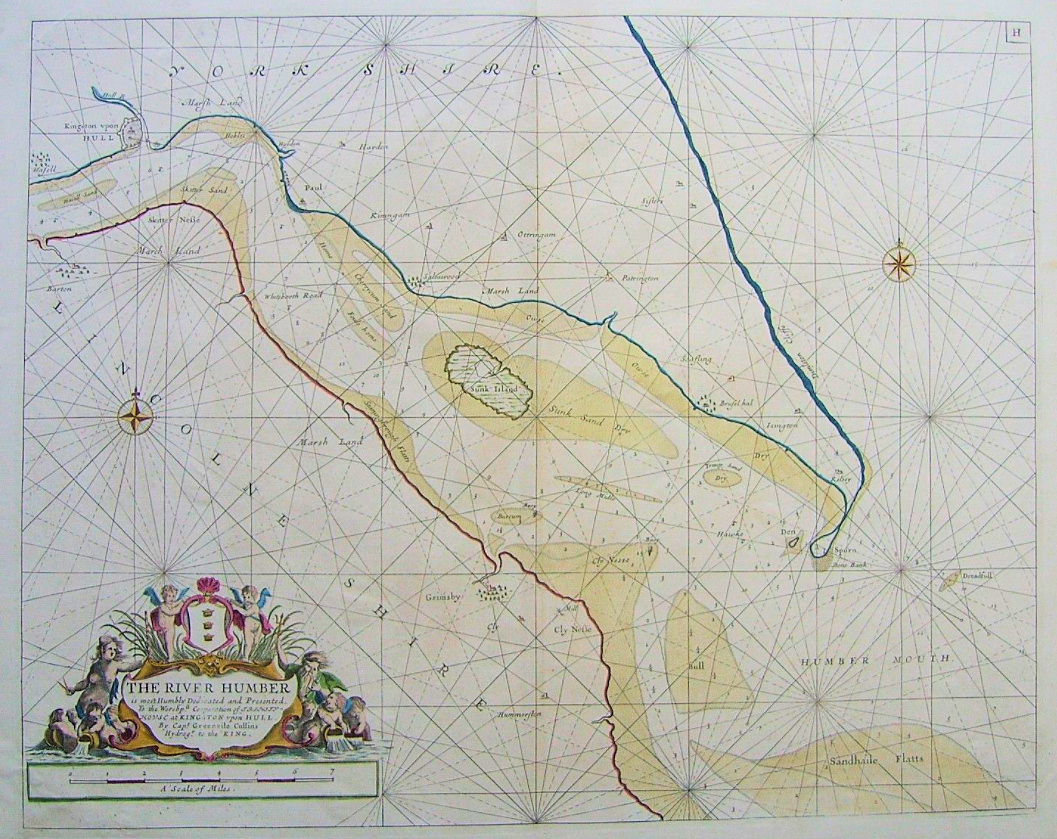
Humber Estuary sea chart by Capt. Grenvile Collins 1759, showing Sunk Island as an actual island in the Humber. The island was gradually increasing in size, and a process called ‘warping’ was being employed to encourage its growth. This involved putting wooden stakes into the river bank at the water’s edge, letting the high tide flow through them. As the water ebbed, the stakes helped to retain the sediment behind them. Over a period of years, vegetation grew on this silt, and the area of arable land gradually increased.
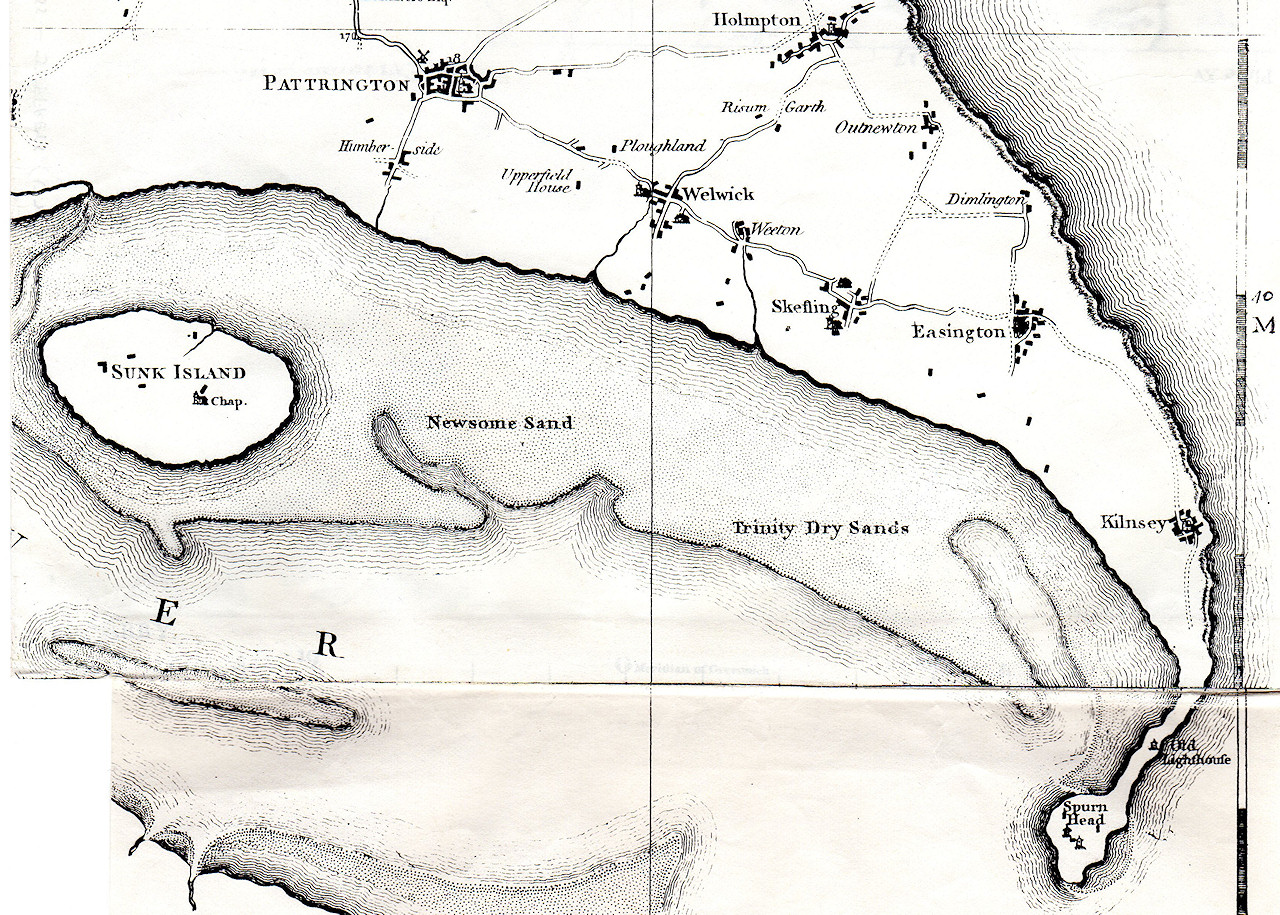
This map from 1780 shows that the Patrington Chanel becoming more difficult to navigate as it had started to silt up, forming Newsom Sand and Trinity Dry Sands. Sunk Island was still an island at high tide.
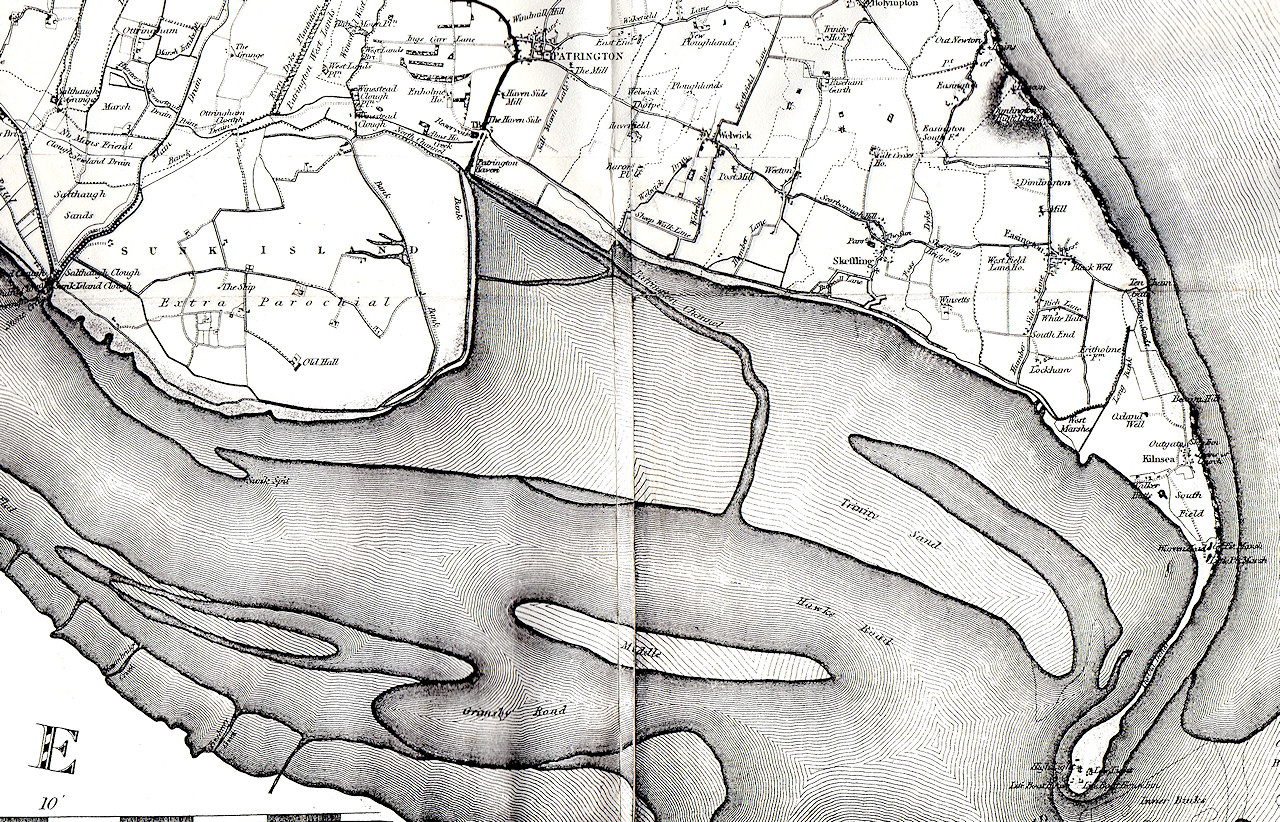
By 1830 Sunk Island was well and truly part of the mainland. Patrington Haven eventually ceased to be accessible as a port by about 1870. Ultimately, the reclamation of the Sunk Island covered centuries, the final part being the very eastern end, south of Patrington, which was not fully secured until as late as 1965.
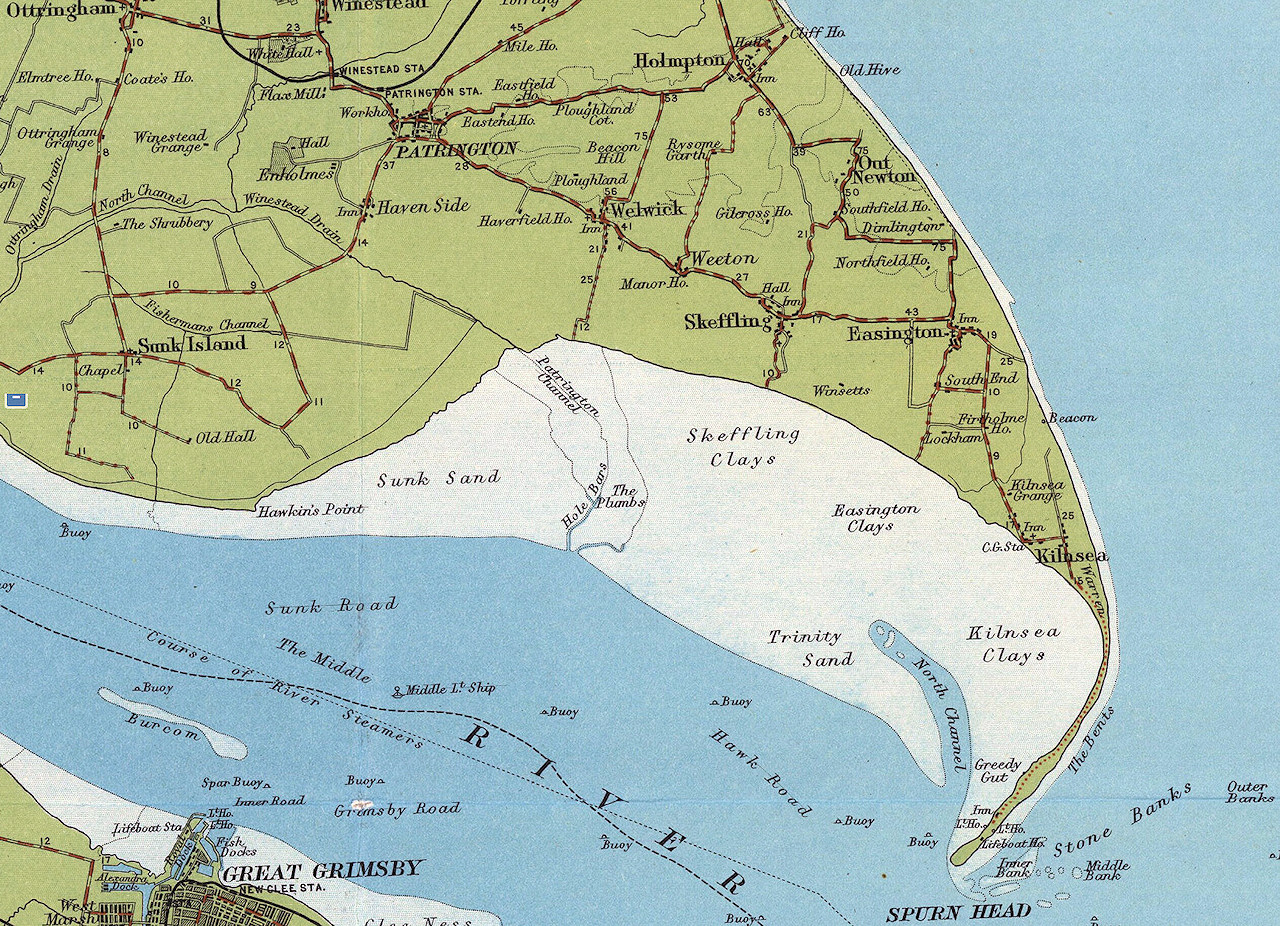
The above map from 1902 shows a clear line between dry land and the tidal areas of Sunk Sand, Skeffling Clays, Easington Clays, Trinity Sands and Kilnsea Clays. The Humber Bank protects the reclaimed land from flooding. A network of drains lead to pumping stations that pump rainwater from the low lying land into the Humber. It is historically interesting that the present Sunk Island actually covers the sites of the towns Tharlesthorpe and Frismersk, which were overwhelmed by the waters c1400.